Formulas and Derivations:

Procedure:
The apparatus used in the experiment was setup as follows:
 |
| Figure 1: The wave driver on one end of the the string |
 |
| Figure 2: Mass at the other end of the apparatus changed for each case in the experiment: Case 1 = 200 g Case 2 = 50 g |
 |
| Figure 3: The function generator output the frequency . The frequency shown on the function generator was recorded for every harmonic oscillation. |
 |
| Figure 4: Example of harmonic oscillation |
1.


2.

3.

 |
| This equation is used to determine the theoretical wave speed. |
Error Propagation:
4.
Using the slope of the graph, wave speed was determined
Slope
|
Wave speed (m/s)
|
Ratio
|
Case I
|
42.109
|
1.8
|
CaseII
|
23.216
|
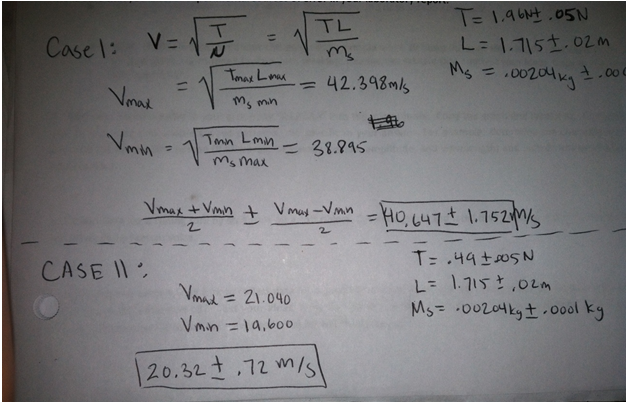
Using the equation v=sqrt(TL/m) to find the wave speed
Equation
|
Wave speed (m/s)
|
Ratio
|
Case I
|
40.647 ± 1.752
|
2.0
|
Case II
|
20.320 ± 0.72
|
The ratios of between the two wave speeds was fairly close.

Wave speed error calculation
|
Percent Error
|
|
Case I
|
(42.109-40.647)/(40.647)
|
3.6%
|
Case II
|
(23.216-20.320)/(20.320)
|
14.2%
|
The differences between the the slope and the equation are quite close with only a small percentage in error.
5.
Case I
|
|
fn
|
nf1
|
13
|
13
|
26
|
26
|
40
|
39
|
53
|
52
|
66
|
65
|
80
|
78
|
93
|
91
|
106
|
104
|
119
|
117
|
134
|
130
|
For Case I, the measured values for fn compare
quite closely to theoretical frequencies of nf1. The first two
values are the same, while the 3rd and 4th harmonic
number are off by 1. The pattern in this relationship shows that with a greater
number in the harmonic there is a slight more variation between the theoretical
and the measured.
n
|
f1/f2
|
1
|
2.2
|
2
|
1.9
|
3
|
2.0
|
4
|
2.0
|
5
|
1.9
|
6
|
2.0
|
The ratio is about
the same for all the harmonic numbers with a constant ratio of about 2.0. The
first frequency was off from the other values by 2.2 which is only a slight
difference which could have come from experimental error. Nevertheless, the
pattern of the ratios with increasing harmonic number is at a constant 2.
CONCLUSION:
The
wave speed in this experiment was calculated in two ways. In the experimental
process, a graph was conducted and the slope gave the wave speeds. Comparing this
wave speed (Case I- 42.109 m/s; case II- 23.216 m/s) to a theoretical, the equation v=sqrt(T/μ) was used. Although
the uncertainty did not agree with the experimental results, the experimental
error was quite low with a 3.6% difference in case I and a 14.2% difference in case
II. Based on the tables and ratios analyzed in the experiment, it can be
concluded that tension in the system affects the frequency and wave speed. According to the graphs the velocity and
frequency between case I and case II showed a difference of a factor of 2. The
relationship showed that with a decrease in tension there was a decrease in
both frequency and velocity. More specifically, as the tension was decreased to
¼ of its value from case I, both the frequency and velocity decreased by a
factor of 2. It also verified that the ratio was consistent through every nth
harmonic, which consistently showed a factor of 2 in the ratio of f1/f2.
This can also be seen from the equation that was used to find the theoretical
values for the wave speed. Because the equation has a radical present the
factor is always decreased or increased by a square or radical
There are many experimental sources of error that need to be
considered in the experiment. One of which was in the inaccuracy of finding the
right frequency when trying to the nth order of a harmonic. It didn’t seem to
be a problem for the first 5 or 6 harmonics, but when moving to higher harmonics
it was more difficult to find the number of loops the string had produced. Therefore
there could have been more inaccuracies in the higher order of the harmonics,
which explains the higher difference between the theoretical as the frequency
had increased. Another experimental error could have risen from the decreased
mass of case II. With the decreasing tension, it was more difficult to determine
the number of loops accurately which led to a more inaccurate way of measuring
frequency. Reading the length of the string was also an error in the experiment
because a more reliable and precise measurement tool should have been
considered since it was dependent on the theoretical value of the experiment as
well as the wavelength.
No comments:
Post a Comment