Wednesday, June 12, 2013

Physics 4C Project


GROUP MEMBERS:
Saxon Aden
Akram Khan

Purpose and Criteria for success:

1) Construct a laser from a blu-ray DVD player optic drive by removing the blue diode and creating a working blue laser.
2) Using the blue diode laser, produce enough energy to burn a match and pop a balloon.
3) Be able to measure the heat produced by the blue diode laser and compare with other laser diodes.
 

Materials: 

Blu-ray DVD diode (ebay.com)
Soldering Iron
Solder
Wire strippers
Wire cutter
4.3 Ohm resistor
Diode housing with lens
1 watt blue laser diode driver (400-405nm)
Knife
Small flathead screw driver
Battery - DC Power Supply (Thank You Professor)
Alligator Clips (Thank You Professor)
Green Diode (amazon.com)
Red Diode (amazon.com)
Thermal Couple (Thank You Professor)

Temperature Meter (Thank You Professor)

Procedure:


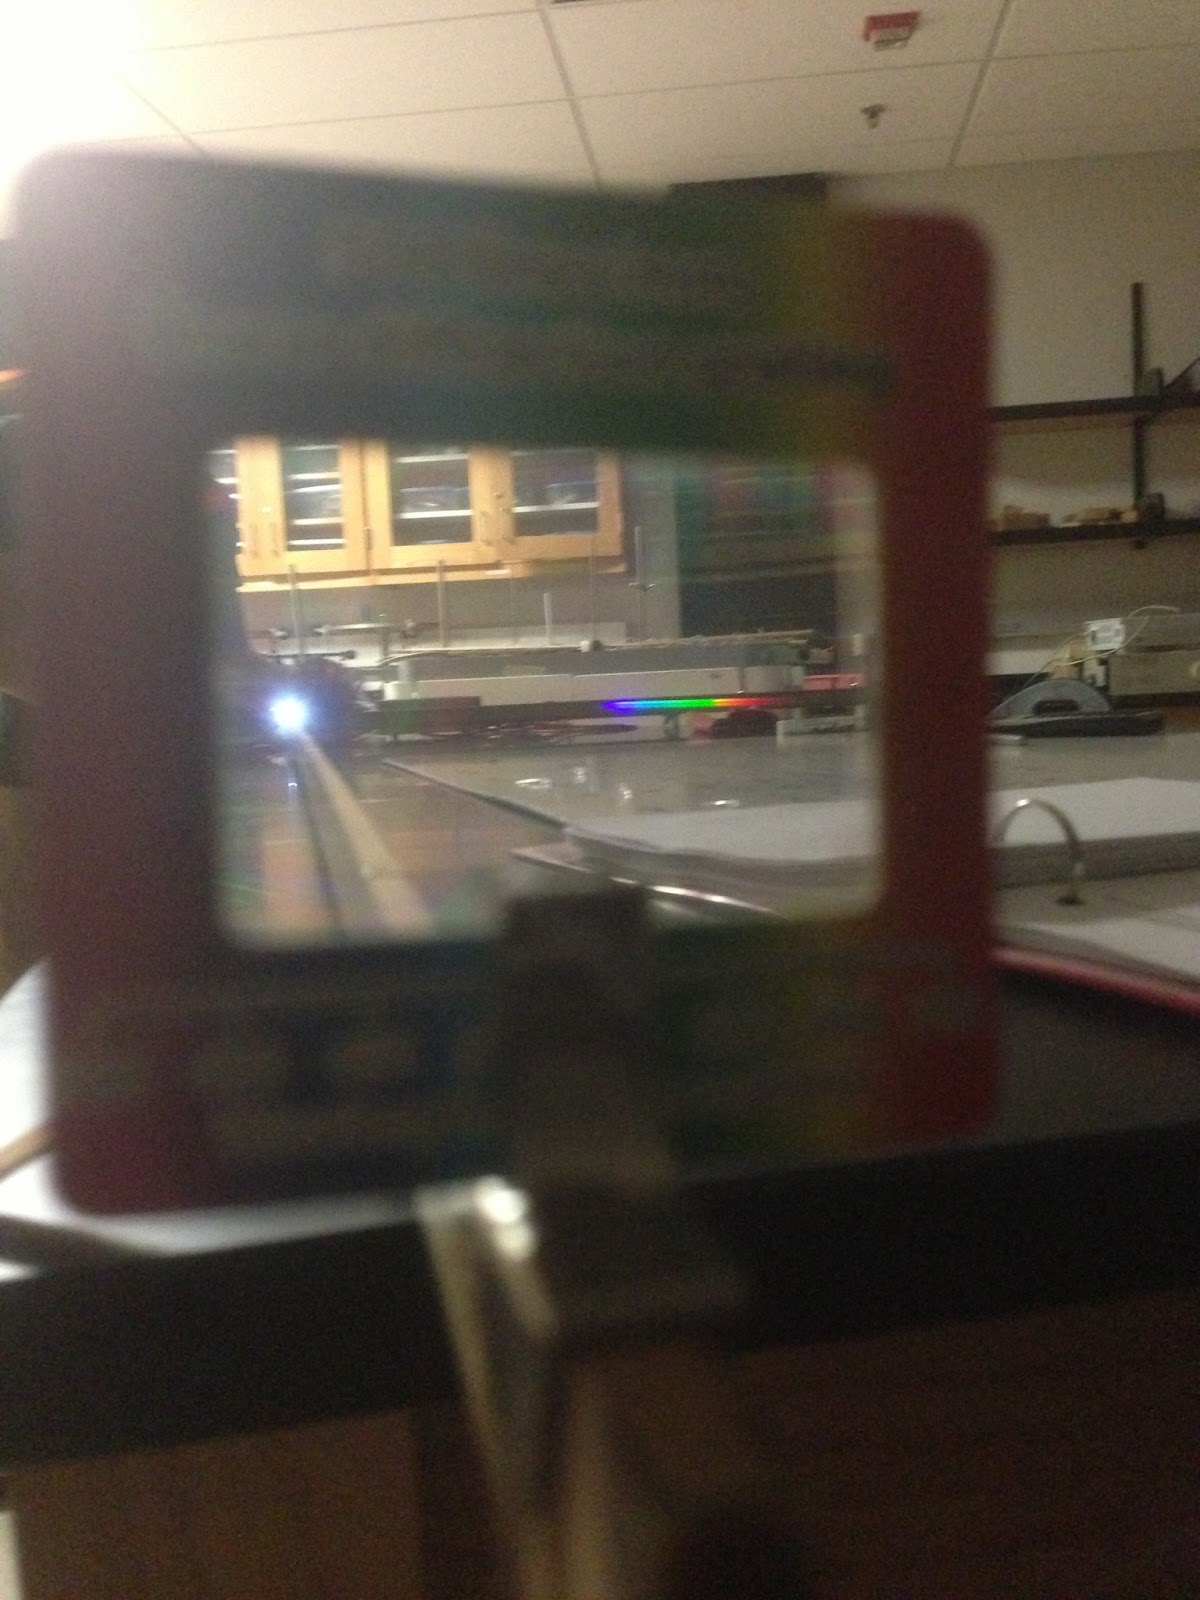
Optic slide of the DVD blu-ray player diode.
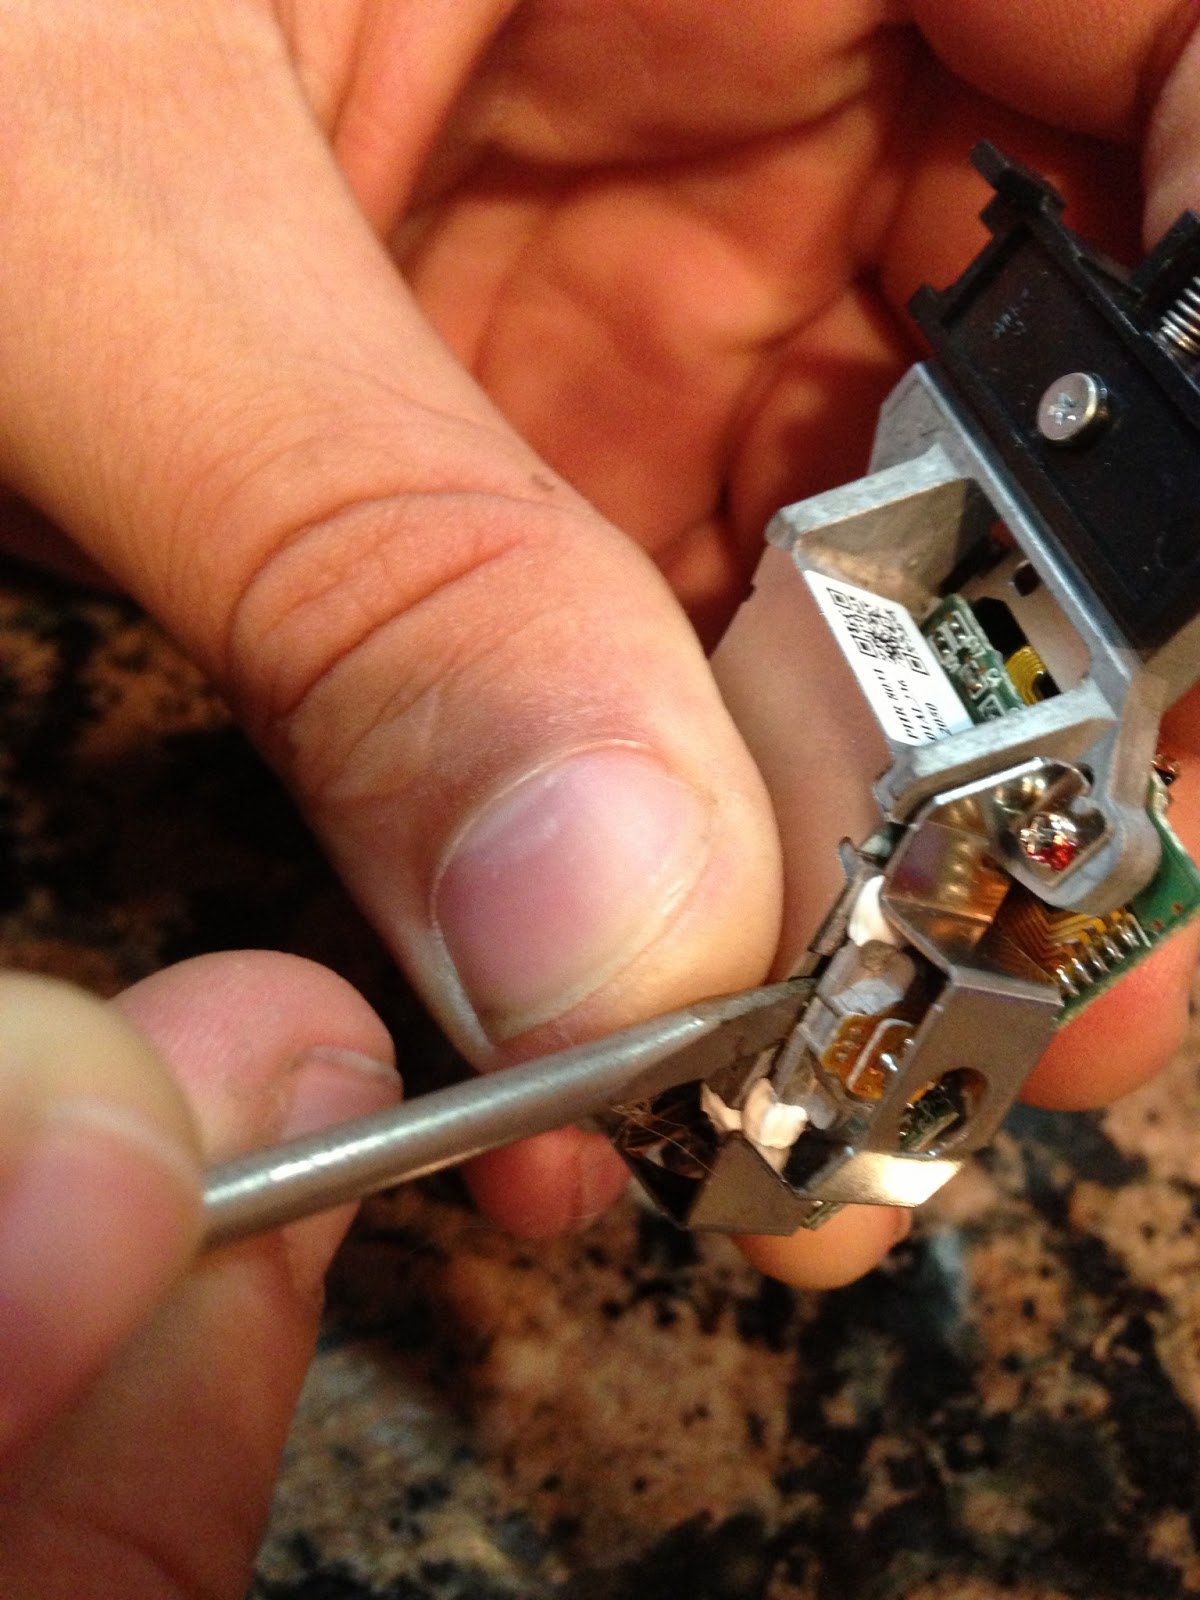
Pry the diode with heat sink out. Caution: Has super glue, it will pop out. The blue diode will be marked with blue mark, other diode is not marked and represents the red/infrared diode (not needed).
Wires that are connecting to diode pins need to be cut
Diode with heat sink
Cut heat sink away from diode. Caution: do not cut diode.

Heat sink and diode removed from eachother

Blu-ray Diode

Remove the wires from the pins that need to be de-soldered

Diode needs to be pressed into a housing.


Diode with housing, (unclamped)

To press the diode into the housing, put a T45 torx bit against the copper base of the diode pin side. Put other end of the torx bit and lens end against the vice clamps. Twist snug, do not over tighten. 

Outcome of the pressing of the diode inside the housing components


Note markings on the diode. Left semicircle marks represents the anode while the right semicircle markings represents the kathode.

Soldering 4.3 Ohm resistor to the anode of the diode.

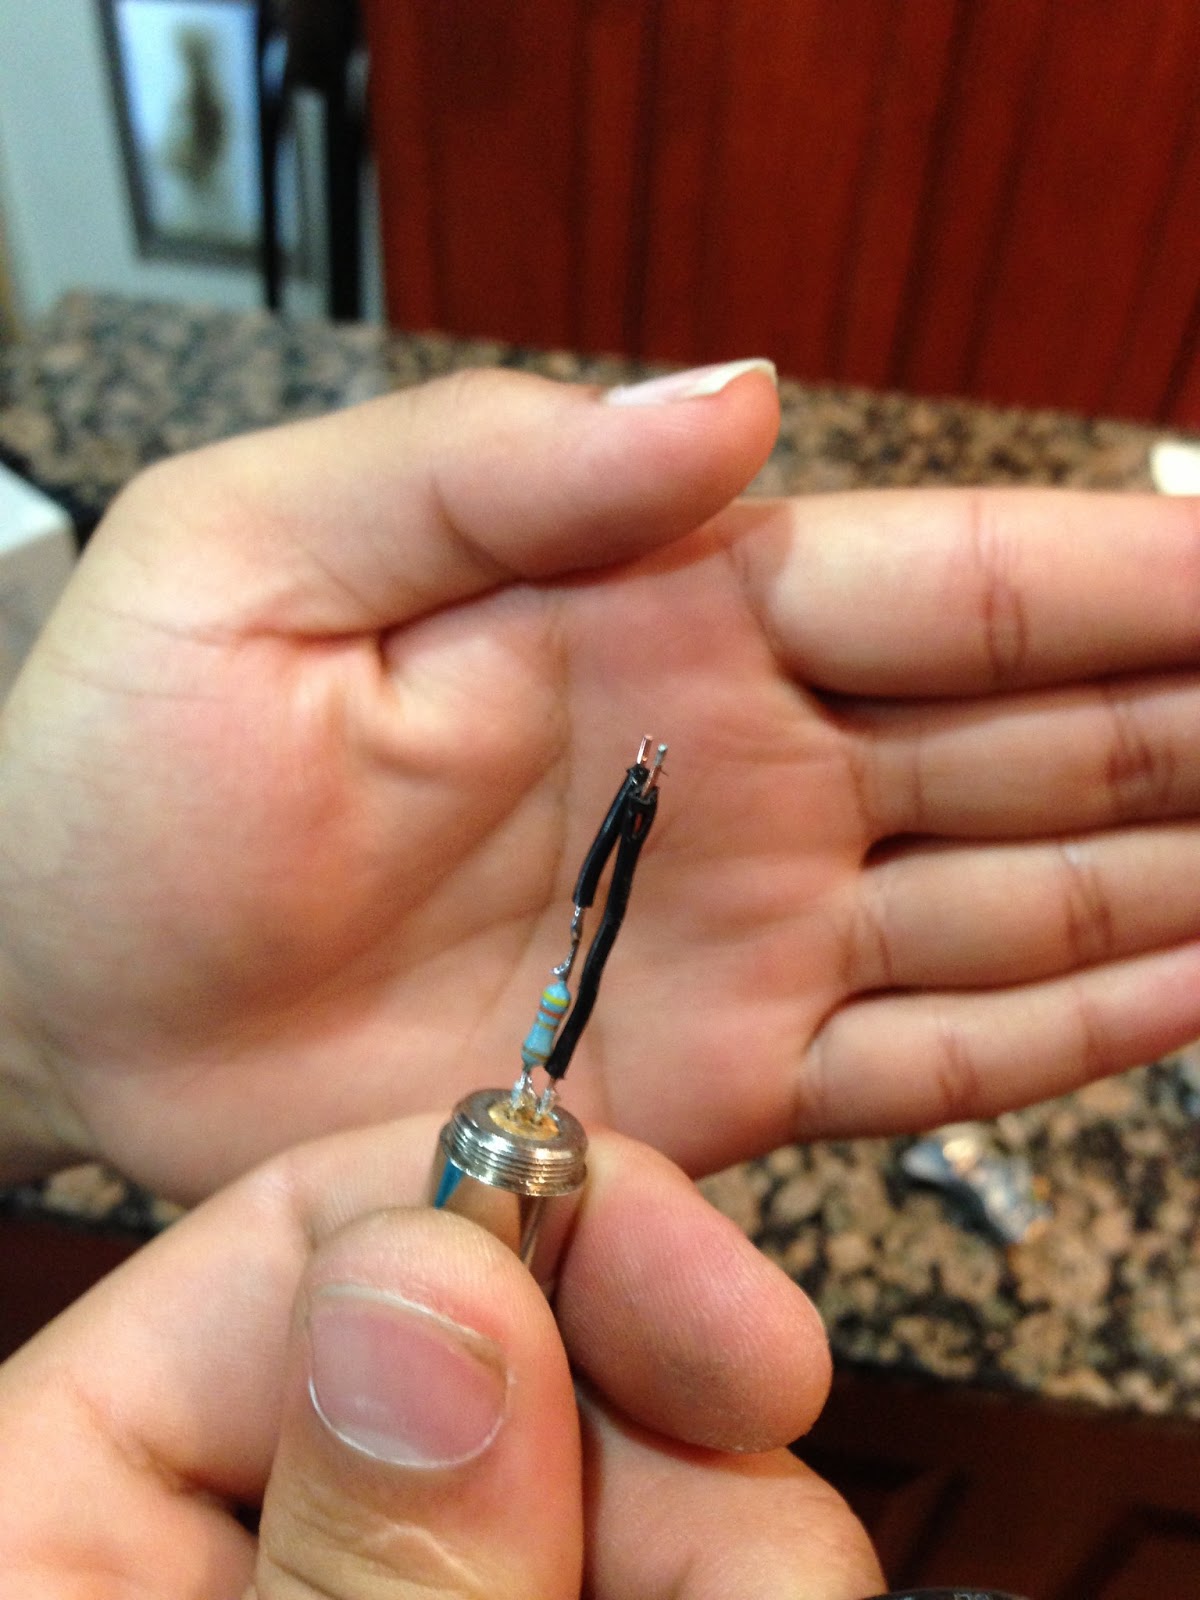
Resistor to the anode, and wire to the kathode ensuring they are the same length. 

driver component of the laser. purpose is to limit power

Solder driver onto housing component. Following the picture; anode connects with southern connector of driver, kathode connects to northern connector of the driver.  

Solder wire to reverse side of driver which will become the positive connector. Negative goes to spring part of the driver.


Measuring temperature of the heat produced by the lasers.

Apparatus of the thermal couple portion of the experiment

Red diode

Green diode


blue diode

DATA AND ANALYSIS:


Conclusion

Green Laser had limiting power output, resulting in high error and skewed data.
•Theoretically, the green diode laser should output power proportional to the amount of temperature reading.


•Much of the power put into the green laser was lost through heat and gave a small and unimpressive temperature reading.


•The blu ray DVD diode was susscesfully used to create a working laser. Not only was the laser working, there was enough power that was put into the laser that produced enough heat to be able to burn some materials such as a match.
•The heat that was produced from the laser was also calculated to show how much heat the laser was producing and how the rate of temperature increased as time increased with a constant level of power.

•The laser was also compared to store-bought lasers which helped compare the power level that it was being given to the lasers. Based on the data and information gathered, much of the power that was being put into the laser was being also lost as heat, especially for the green laser since there was a limiting factor preventing the laser from producing any heat. There was uncertainty given for that and based on the uncertainty it can be verified that the more power that was given to a laser, the higher the temperature would increase as time progressed. 


Sunday, May 26, 2013

Experiment 16: Determining Planks Constant

PURPOSE: In this experiment a circuit will be assembled to measure the voltage across an LED and wavelength will also be calculated which will lead to the calculation of finding h, Planks Constant, which has a value of 6.626 X 10^-34.

PROCEDURE:

red LED across voltage in series

View through slit


View through slit of white light.

 DATA & ANALYSIS:


Measurement of Voltage and Distance (D) of spectra
LED
Red
Blue
Green
Yellow
Voltage (V)
1.884 ± .01
2.711 ± .01
2.825 ± .01
1.924 ± .01
Trial 1 (cm)
67.25
61.2
69.2
44.75
66.0
50.0
65.5
55.5
Trial 2 (cm)
69.9
61
57.5
44.75
64.0
51.8
65.0
54.5
Trial 3 (cm)
68.0
60.0
57.8
46.0
63.0
50.25
63.8
54.5


CONCLUSION: There were many steps taken to find and verify planks constant. Using a number of different LED lights, the wavelength was determined by finding the distance of the spectra and using the law of similar triangles. The voltage was also determined which would be used along with the known charge of an electron to find the energy, E of the system. Using the value of E and the calculated wavelength of each light, planks constant was able to be determined. The slope of E and c/λ, the value would give the value of the planks constant from the values of LED lights. However, the given value as shown gives a high error value.
Planks constant is known to be 6.626E-34, and the slope value had given a value on the order of 10^-33. Because of this error, the experiment then relied on the theoretical approach of calculating the h value of each LED and finding the average value. This had given a value of 10^-34 and more specifically an error with 15% which is an accepted value. Based on these values planks constant is verified based on these results.

Experiment 15: Quantum Mechanics: Potential Energy Diagrams


PURPOSE: To observe and understand potential energy in Quantum Mechanics and verifying the probability of finding particles. 


1. The range of motion is between -5 and 5 cm.
2. The particle does not have enough kinetic energy to pass through that boundary. 
3. There is a higher probability of finding the particle from 05 to 0 cm because it has a higher potential energy on that side. 


4. The range of motion increases when the energy is doubled. 


5. The graph is an inverted parabola.


6. The particles will be most likely found at the ends where the boundaries are located.


1. 
E = n2 h2 / 8 m L2
E = (1)2 (6.626 x 10⁻³⁴ J s)2 / 8 (1.673 x 10⁻²⁷ kg) (10 x 10-15 m)2
E = 3.3 x 10⁻¹³
E = 2.1 MeV 


2. 4(2.1eV) = 8.4 MeV for infinite well but not for finite well

3. In the infinite well it is has larger energy in its first excited state because it has a shorter wavelength than in the finite well


When the potential energy is decreased, the total energy of the n = 3 state decreases as well because the U(x) function decreases the area the particle can be in and the wavelength decreases.


The penetration depth decreases as the mass increases. This is because the mass is becoming measurable and cannot travel in to the forbidden region. 


Experiment 14: Color and Spectra

PURPOSE: In this experiment, the spectrum of colors were viewed in white light and the light from colored filters that contains hydrogen gas.

FORMULAS & DERIVATIONS:


Illustration of the experiment. An observer will see through the double slit which has a grating of about 500 lines per mm. 

Using similar triangle technique, the following derivations can take place.


PROCEDURE:
SETUP OF EXPERIMENT


Top View


The distance of the color spectrum was measured from the light source.


The color spectrum of white light

Spectra of a Hydrogen gas

Setup with Hydrogen Gas as the "light source"


Spectra of Hydrogen gas. 


DATA & ANALYSIS

Measurement of the white light spectra:

Calculation to determine wavelength for both ends of the spectrum. Note d is given by the double slit (there are 500 lines per mm). The slit was 1.89 meters away (L). The distance of the light, D was a measured value with uncertainty.
Uncertainty was measured through standard deviation. The Theoretical values for the visible spectrum was given and the uncertainty lies within the true values of the wavelength.


Calibration of the wavelength was determined on the right side of the board using both the experimental and theoretical values of the wavelength.
Measurement of Hydrogen Gas

Calculations for the different colors presented in the spectrum. The yellowish-green color was not calculated since it is not in the spectrum of hydrogen gas, and perhaps it was light interfered from another source. 

Calculation of the theoretical wavelengths of  hydrogen gas using the Bohr Model. 

ERROR ANALYSIS

The uncertainty does not lie within the actual values based on the standard deviation model of uncertainty, and the wavelength between the 1st and 3rd line was not visible to the naked eye


CONCLUSION:
The spectra of visible light from the white light was verified and based on the uncertainty the values were also verified by the theoretical values. The white light helped find a means of calibration for the next portion of the experiment in order to verify the spectra of hydrogen. There were only three of the four lines that were seen that would indicate hydrogen in the spectra. The reason for the λ24   to not be seen is that it was too close to the other lines which made it harder to see with the naked eye. The values of the wavelengths from the experimental side however could not verify the the theoretical values of hydrogen based on the uncertainty which was determined by standard deviation. Consistently, the experimental wavelengths all fell shortly under the true values of the wavelength. When calculating percent error the values all fall under 8% error which shows both precision and accuracy in the experiment. Therefore, the spectra of hydrogen can be verified in this experiment. Although, the second line could not be seen, based on the theoretical calculations there seems to be a hole where the value should be indicating that this spectra does indeed belong to hydrogen.